


Portfolio & Risk Analytics for Private Wealth
POWERING PORTFOLIO MANAGEMENT & RISK STRATEGIES
As a private wealth client, your wealth depends on various factors. We manage and anticipate changes in complex markets every day, plan for every possibility and execute accordingly. We also have a flexible plan for responding to economic, financial and political changes. The challenges have never been greater.
Portfolio & Risk Analytics for private wealth clients empowers institutional-grade implementation of your portfolio investment and risk management strategies. The outcome is making quicker, more informed decisions and measuring market-related and security-specific risk exposures for our private wealth clients' portfolios.
At Coastlight Capital, we are committed to continuously adding greater clarity to investment decision making and ensuring that our clients feel completely confident in these critical decisions.
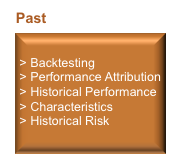
Past
Portfolio & Risk Analytics gives the ability to analyze the historical performance of your equity, fixed income or multi-asset portfolio on an absolute basis or relative to a benchmark. It identifies the sources of your portfolio’s absolute or excess return by asset class, sector, geographic region, a custom classification, and even based on a multi-factor risk model.
HISTORICAL PERFORMANCE ANALYSIS
Shows how your portfolio has performed over time on an absolute basis or relative to a benchmark
» The Performance report examines the historical cumulative performance of your portfolio relative to its benchmark
» Analyzing different time frames to hone in on a specific sub-period or visualize long term performance patterns
» Examining standard deviation, beta, realized tracking error and dozens of other commonly used risk/ return measures
» Providing insight into the drivers of historical risk and performance
PERFORMANCE ATTRIBUTION
Understanding the sources of your portfolio’s historical performance based on sector and security bets
» Analyzing your active portfolio performance results by examining allocation effect, security selection effect and currency effect
» Breaking down your portfolio by asset class, sector, geographic region, duration, credit quality or any other custom classification
» Calculating the impact of yield curve movements and spread effect on your fixed income portfolio’s historical performance relative to its benchmark
» Drilling down for full transparency into the data used to calculate the returns, such as capital events, accrued interest and cash flows
FACTOR-BASED PERFORMANCE ATTRIBUTION
Analyzing the sources of your portfolio’s historical performance based on multi-factor risk models
» Explaining your portfolio performance in terms consistent with an ex-ante risk management approach by leveraging multi-factor risk models fully integrated with historical performance attribution
» Security returns are decomposed into the portion coming from exposure to risk model factors, such as industry, country, style, currency, curve and spread, and the portion coming from selection effect
TRANSACTIONS-BASED ATTRIBUTION
Understanding how your transactions and transacted price levels impacted the portfolio’s total return over a historical time period
» Quickly identifying which trades contributed/detracted from total return
» Isolating transaction returns at the instrument level
» Analyzing Transaction Effect, which quantifies the contribution to return due to historical trades
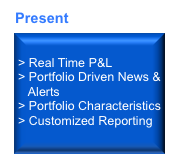
Present
Monitoring the intraday performance of your equity, fixed income or multi-asset portfolio in real-time as well as quickly accessing the news which is most impacting your portfolio today. Immediately identifying today’s top and bottom return contributors.
Real-Time Monitoring
Monitoring your portfolio’s intraday performance relative to the prior day’s close prices
» Tracking how your portfolio is performing today on an absolute basis or relative to a benchmark
» Quickly identifying the top and bottom return contributors for your portfolio by security, by industry, or by any other classification
» Displaying the intraday cumulative return chart or heat map for a visual representation of today’s activity
» Leveraging the numerous intraday pricing feeds for fixed income securities
PORTFOLIO NEWS & ALERTS
Instantly viewing the stories relating to and impacting your portfolio
» News content is fed by more than 60,000 sources, including global press releases, broker research and blogs
» Alerts and unlimited keyword criteria can be applied to your portfolio, ensuring that every piece of news and research critical to you is captured
» Sorting your portfolio news with different filters, including “User Activity,” which uniquely shows the stories of most interest to other market participants in the global investment community
EVALUATing Your PORTFOLIO’S CURRENT STRUCTURE
Portfolio & Risk Analytics centralizes the critical data and analytics needed to understand the structure of your portfolio. Displaying the fundamental metrics you care about most, such as P/E and dividend yield for equity portfolios or effective duration for fixed-income portfolios. Creating custom growth or trend metric leveraging a vast fundamentals database.
AGGREGATE PORTFOLIO CHARACTERISTICS
Analyzing the fundamental characteristics of your portfolio that matters most
» Analyzing key equity or fixed income characteristics of your portfolio and seeing how they compare to a benchmark on a specific date or as a time series trend
» Aggregating these measures by any classification, such as a sector, country, or any custom defined scheme
» Uploading custom data and displaying alongside industry-relevant data
» Charting characteristics to see relative exposures versus the benchmark
PORTFOLIO CASH FLOWS
Understanding the projected cash flows of your portfolio
» Displaying the projected income generated by your portfolio over a time specified horizon in both chart and table form
» Cash flows are based on Bloomberg Dividend Forecast (BDVD) for equity instruments, coupon and principal payments for fixed income instruments
LIQUIDITY RISK
Analyzing your equity portfolio’s structure in terms of the overall liquidity of your positions
» Understanding your equity portfolio’s liquidity based on the average or total days to liquidate all or a portion of your positions
» Quickly identifying the most illiquid stocks in your portfolio as well as the concentration of your portfolio’s market value in more vs. less liquid securities
» Customizing liquidity risk analysis based on a specified participation rate and average trading volume history
» Analyzing your portfolio’s liquidity horizon based on the length of time it would take to liquidate a preset percentage of the portfolio’s total market value
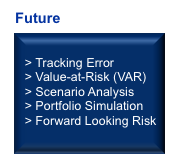
Future
UNDERSTANDing YOUR PORTFOLIO’S FUTURE RISK EXPOSURES
Coastlight Capital uses fundamental risk factor models to measure and analyze your portfolio's risk through multiple lenses, including tracking error, stress testing, and Value-at-Risk.
Tracking Error
Analyzing your portfolio’s ex-ante (predicted) risk by using multi-factor risk models
» Fully transparent fundamental risk factor models provide global, multi-asset class coverage across all of your positions
» More informative risk decomposition using market standard as well as custom classifications
» Calculating risk in absolute terms or relative to a benchmark, another portfolio, fund or index
» Providing the ability to click through to the underlying fundamental data for full risk data transparency
SCENARIO ANALYSIS
Stress testing your portfolio and identifying sensitivities to selected market risk factors
» Evaluating your portfolio using a variety of historical stress scenarios— such as the global financial meltdown in 2008 or the Libyan oil crisis in 2011
» Creating custom stress tests to gain greater insight into your portfolio’s risk and validate current portfolio exposures
VALUE-AT-RISK
Analyzing the tail risk of your portfolio using the latest risk modeling techniques
» Global multi-asset class security coverage, with Stress Matrix Pricing on derivatives for more accurate Value-at-Risk (VaR) forecasts
» Measuring the Value-at-Risk (VaR) impact on proposed trades using Trade Simulation mode and optimization
» Supporting Monte Carlo, Historical, and Parametric Value-at-Risk (VaR) Methods across multiple confidence levels to calculate the maximum expected loss
» Robust proxy capability to assist in exception handling
SIMULATing TRADES & OPTIMIZing YOUR PORTFOLIO
Portfolio & Risk Analytics for private wealth clients includes fully integrated portfolio construction tools. Trade Simulation and Portfolio Optimization allow us to easily and rapidly identify trades that will ensure we make the best investment decisions.
TESTing THE IMPACT OF TRADE IDEAS
Analyzing how your portfolio’s characteristics and risk structure would change based on potential trades
» Evaluating potential trades or edit existing positions by using the Trade Simulation functionality
» Analyzing in real time the impact of hypothetical trades on your portfolio across the entire analytical suite of portfolio tools available within Portfolio & Risk Analytics for private wealth clients
DISCOVERING YOUR PORTFOLIO’S OPTIMAL CONSTRUCTION
Leveraging the built-in Portfolio Optimization capabilities to construct your optimal portfolio
» Iterating through multiple versions of hypothetical trades to build an efficient frontier of optimal portfolios
» Uploading custom security-level expected returns or any other data as inputs to the Optimizer
» Leveraging Transaction Cost Analysis model to incorporate market impact into the test
» Backtesting the strategy to create a model portfolio and analyze its historical performance
IDENTIFYing THE TRADES TO MEET YOUR INVESTMENT OBJECTIVES
The Optimizer delivers suggested trades for analysis with resulting active total risk or any other optimization goal
» Easily identifying the best set of trades that will give your portfolio the exposures that you want it to have
» Analyzing your hypothetical portfolio which incorporates these trades seamlessly in Portfolio & Risk Analytics
All photography by Jared Chambers